- Home
- Our strategy
-
Our stories
-
More Health
- A guide to stop rabies in Southeast Asia
- A platform for chronic patients’ needs in Spain
- Advancing health equity in rural Mexico
- At the heart of health equity in the U.S.
- Better access to healthcare for Indigenous Peoples in Canada
- Coaching patients in Mexico to improve health
- Ecological stoves safeguard family health in Mexico
- How mobile medical clinics tackle health equity Down Under
- Joining forces to fight diabetes in Mexico
- Moving towards a rabies-free world
- Partnering in France for better healthcare solutions
- Soaring to save lives: Tackling health disparities in Africa via drone delivery
- Striking a blow against strokes in Brazil
- Total stroke solutions for China
- Traveling the LastMile in Kenya
- Veterinary care for pets of people experiencing homelessness in the UK
- Winning time with ‘stroke-ready’ hospitals and heroes
- Young and old unite against strokes in Brazil
-
More Potential
- Hope for youth with disabilities in South America
- Making More Health: Engaging with social entrepreneurs for sustainable health solutions
- More women for entrepreneurial health solutions
- Volunteering at Boehringer: Global impact through local engagement
- Why belonging matters – to all of us
- Women in STEM: Passion for science
-
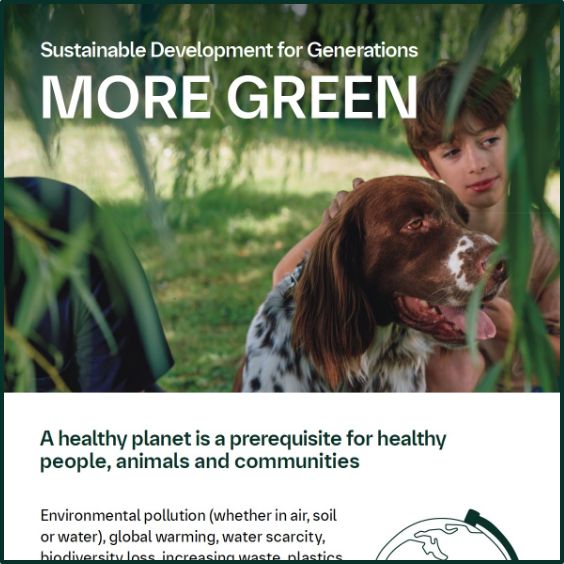
More Green
- Clean Air Champions: Tackling air pollution in UK healthcare
- Looking at supply chain emissions through the magnifying glass
- Making our medicines greener through eco-design
- On the path to decarbonization: How we reduce our emissions
- Promoting production circularity with a powerful partnership in Denmark
- Taking action to reduce plastic waste in Japan
- Waste reduction and sustainable energy in Germany
- Water stewardship: Every drop counts
→ -
More Health
- Our key figures
Our key figures
This overview of key performance figures demonstrates our impact across our three sustainability pillars. By representing significant milestones we’ve achieved, these accomplishments underscore our dedicated efforts towards fostering a healthier future for people, animals, and our planet.
MORE HEALTH
Patients reached through our health equity programs and initiatives
149
K
in underserved communities in 2023 through product donations
In 2023, we provided
43.2 M
rabies vaccine doses in endemic countries for disease prevention.
*
Status: as of March 2024, number of patients with acute stroke treated to-date in an Angels initiative stroke ready hospital
MORE POTENTIAL
Engaging our communities
8,625
employees engaged in volunteering in 2023
Diversity, Equity and Inclusion (DEI)
Over
53,000
employees worldwide
Diversity, Equity & Inclusion
All employees by generation

… representing
138
different nationalities
… of which
50%
are female
Thereof around
8,600
employees in supervisory roles
Diversity, Equity & Inclusion
Employees in supervisory roles by generation

… representing
81
different nationalities
… of which
40%
are female
MORE GREEN
Steering environmental responsibility
Our certifications worldwide
Certifications we have received for our achievements in minimizing our environmental impact at various sites across the globe.
Filter
Gainesville (USA)
Re-certification of our sites
Paulínia (Brazil)
2023 certification
Sant Cugat (Spain)
Re-certification of our sites
Dortmund (Germany)
Re-certification of our sites
Kathrinenhof (Germany)
Re-certification of our sites
Fornovo (Italy)
2023 certification
Sant Cugat (Spain)
Re-certification
Dortmund (Germany)
2023 certification
Fremont (USA)
2022 certification
Promeco (Mexico)
2019 certification
Sant Cugat (Spain)
In 2023, the production site in Sant Cugat (Spain) initiated AWS implementation
Shanghai (China)
Re-certification
Shanghai (China)
Re-certification
- Carbon Neutrality and Zero Waste to Landfill certifications accredited by TÜV Rheinland
- Water Stewardship certification by the Alliance for Water Stewardship (AWS)
Downloads
Find out more about our initiatives and achievements on our journey towards a sustainable future.
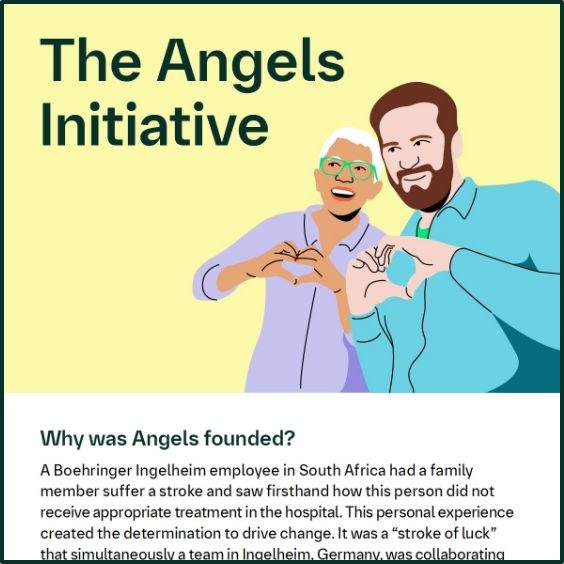
Angels Initiative Infographic (PDF)
Healthcare initiative getting hospitals worldwide “stroke-ready”